Data
I take statistics I find online and translate them to drawings in space, made with lines of thread.
When I started making this work in 2016, I was living in San Francisco. I was active in the art community and went to gallery openings a few times a week.
At every opening there was talk about the high rents and cost of living. I started thinking about how the global monetary system works, and the foundations of wealth.
Numbers tell stories like photographs do. We can distort numbers the same way we distort photos.
For example, in Home Sale Prices by Year 1971-2015, Median San Francisco, CA, Median California, Median United States, a real estate pitch is also a picture of the high cost of property in the Bay Area.
We are living in divisive times. It’s easy to forget how easy it is to manipulate data when we are using it to make a point or defend an argument.
These installations are tricky because at first glance they are simple abstract objects, just color and light. I am excited by the second read, where the abstraction and factual information play off each other, in that back and forth.
Home Sale Prices by Year 1971-2015, Median San Francisco, CA, Median California, Median United States

This site-specific installation at State was also created in miniature, you can see it here. Many pieces of Data exist only in miniature form.
Homeless housing inventory, Permanent supportive housing, year-round emergency beds, and transitional housing, United States and Multnomah County, 2005-2014


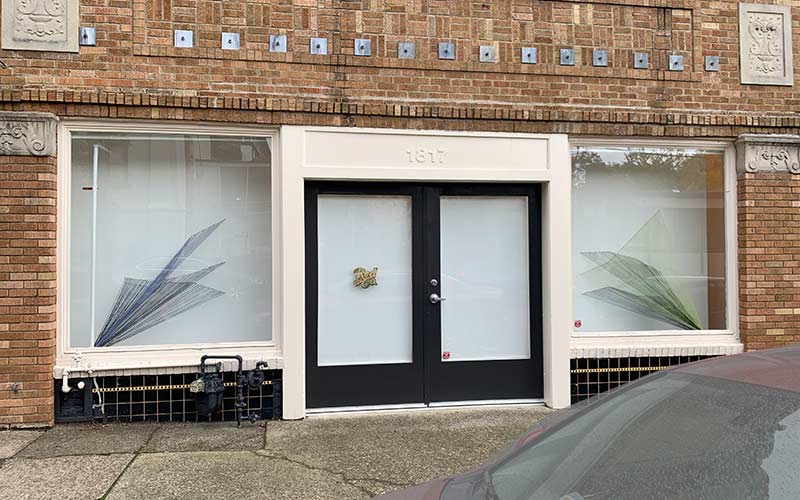
This was the first site-specific installation at Red&Co. and it speaks to the homeless problems in Portland, OR .
On the left: Homeless housing inventory, Permanent supportive housing, year-round emergency beds, and transitional housing, United States, 2005-2014, 2019
On the right: Homeless housing inventory, Permanent supportive housing, year-round emergency beds, and transitional housing, Multnomah County, 2005-2014, 2019
In this installation, the data reveals a difference in housing priorities that makes the homeless more visible in the Portland area. At the same time, it underlines the continuing challenges of homelessness across the country.
Ice sheet contribution to sea level, Antarctica, Greenland and Combined, 1992-2012

This site-specific installation was part of the exhibit Wild at Root Division. From the curator Marisa Argona, “As the realities of human impact on our global ecosystems are escalating, this show points to the undeniable truths of our connectedness to everything living and our increasingly mediated experience of nature.”
Crochet thread, screw eyes, felt, 10 x 14 x 8 ft, 2017
Crochet thread, screw eyes, 7 x 6 x 2.5 ft, 2019


Thread, acrylic, and found wood on birch panel, 12 x 16 in, 2019

Wood, canvas, crochet thread, gesso, 57 x 42 x 18 in, 2017